Thursday, February 14, 2008
Feeder Cattle Prices Whip-Lashed By Corn Prices

We often comment on how corn prices are whip lashing feeder cattle prices. The chart below shows the whip lash for 2007.
# posted by Dr. Harlan Hughes @ 2:07 PM 
CME Feeder Cattle Price Index

The CME Feeder Cattle Futures Settlement Prices are based on the CME Feeder Cattle Index. This index, in turn, is calculated on the 7-day moving average of cash salebarn sales in cattle country.
The dramatic down turn in the Feeder Cattle Index started in October 2007 and continued through Mid-January 2008. Preliminary analysis suggests that the feeder cattle price index has turned upward again in late January 2008.
I am expecting this index to peak in 2008 near grass time at $8-$10 under the 2007 peak but near the grass time level of 2007. What happens after that, depends of the weather scares in corn country.
# posted by Dr. Harlan Hughes @ 1:58 PM
Wednesday, February 13, 2008
Canadian Cattle Imports

This chart is Canadian live cattle imports -- both feeder cattle and slaughter cattle. Under utilized U.S. feedlots are very willing to feed Canadian cattle. It helps keep the feedlots fuller. Note the increase of Canadian cattle imported from May07 through Nov07. While not shown on this chart. Imports have remained very high into Feb08 and I see no reason for them to decrease any time soon.
As you think about Canadian imports, keep these import numbers in perspective. We produce around 27,000,000 feeder cattle in the U.S. So… 180,000 imports is really not that significant.
# posted by Dr. Harlan Hughes @ 1:54 PM
U.S. National Beef Cow Inventory

Back to the basics. This chart shows that the cattle cycle has been broken. All indications are that the U.S. cow herd is not going to grow for the rest of this decade. In fact, the nations cow herd could continue to slowly decrease through 2010.
The implications here is that we are projected to have a smaller calf crop for the rest of this decade. This implies that feedlots will not be able to find feeder calves to keep all lots full. Well financed feedlot will bid aggressively for feeder cattle. The benefactors of this aggressive bidding will be ranchers.
# posted by Dr. Harlan Hughes @ 1:50 PM
Kansas Slaughter Cattle Basis (Cash minus Futures)

Some of my IRM Cooperators are involved in finishing cattle so this should be of interest to those producers. This is the basis calculation (cash minus futures) prepared by Kansas State University for Kansas. This data is the average of the last 3 years. The basis for where you sell your cattle may vary a little from these but should follow this pattern. (I am working on getting some Eastern Wyoming/Western Nebraska basis data summarized.)
We know that there is generally a shortage of finished cattle around April -- some times also in March. We are out of old crop (2006) finished cattle and most new crop (2007) calves are not yet ready for the market.
This year I expect to see slaughter numbers really increase in June and July as more 2007 calves skipped winter wheat grazing went straight to the feedlot at weaning. I am not sure the market is really reflecting this yet.
Market prices tend to peak for the year in April when very few ranchers have finished cattle to market. The two groups of ranchers that can have finished cattle to market in April are (1) those that early weaned their 2007 calves and (2) those that calve Jan/Feb and wean in September.
For example, a producer selling his calf-feds in April 2008, should expect to sell his cattle $3 over the April futures prices. The projected basis range is from a +$2 to a +$4.75. Given the 12 Feb 08 Closing Apr08 contract of $94.77, this suggests a Kansas April 2008 slaughter cattle price of $97.77 -- not bad -- provided your breakeven price is lower; however, My PPP-MIS model for a "Winter Calving Cow Herd" has Jan/Feb born calves finishing in mid-Apr with a breakeven of $104/cwt.
Note the basis price goes negative around 1 July and stays negative for the rest of the year. When do you think most 2007 calves will be harvested? It is June, July, and August.
The ranchers that retains his calves, is rewarded if he is part of a production system that harvests his calves in April of each year.
# posted by Dr. Harlan Hughes @ 1:47 PM
Predicted Corn Carryover

Double Click the image to load a larger version into you computer for viewing and printing from you browser.
I advise ranchers that the best way to observe (and even predict) corn prices is to watch the Carryover projections. The lower the carryover, the higher the annual corn price. Ending stocks as a % of Total Usage is that carryover. Most analysts will use carryover as their predictor of annual corn prices. Researchers have even developed a statisitical historical relationship between carryover and corn prices.
Note that 2007/08 projected carry over is even lower than the 2006/07 carryover. Also note how low the 1995 carryover was when we had the last run-up in corn prices. This all suggests, at least to me, that corn prices are going to some higher in 2008. This all is even before we take the growing season weather into account.
I am suggesting corn prices will be in the high $4.00s range for 2008 -- up another dollar over 2007s.
# posted by Dr. Harlan Hughes @ 1:31 PM
March 2008 Feeder Cattle Futures Prices

The above chart is the daily March Feeder Cattle Prices from early September Through 12 Feb 2008. This chart shows the downward trend from Early Oct through Mid to late January. It also shows an upward trend since the low around 20th January. All indications are that prices may well trend upward into early summer. The desire for grass cattle may well be driving up these prices.
# posted by Dr. Harlan Hughes @ 12:26 PM
Tuesday, February 12, 2008
Long-Run Planning Prices for Emerging Biofuel Era
.jpg)
Double click on chart to load an expanded version into your computer. You can then print it from your computer.
All indications are that the Cattle Cycle has been broken by the emerging biofuel era. USDA has published a new set of long-run planning prices that pertains to the biofuel era. I am now using these planning prices with ranchers around the country as we build their 2008 to 2010 business plans.
If you are needing or wanting help to build your 2008-2010 ranch business plans, please contact me at harlan.hughes@gte.net or 701-238-9607.
# posted by Dr. Harlan Hughes @ 12:31 PM
Beef Cow Profits

Double click on the small image to see the chart of Beef Cow Profits over the last several years with a projection for 2008. Indeed, we have had several years of very good profits per cow. The emerging biofuel era, however, is changing this.
My projections is realatively steady beef cow profits for the rest of this decade. Now is the time for ranchers to focus on redcuing their costs of producing a hundredweith of calf (UCOP).
If interested, contact Harlan Hughes (harlan.hughes@gte.net) or 701-238-9607 and I have a new IRMez Cost & Return System designed to help ranchers lower production costs during this emerging biofuel era.
# posted by Dr. Harlan Hughes @ 12:17 PM
Tuesday, June 26, 2007
Revised Long-Run Beef Planning Prices
 To printout the chart, double click on the chart icon and a larger version will load into your computer. You can use your browser's print command to print this larger chart.
I combined USDA's Long-Run Cattle Planning Prices and my Long-Run Cattle Planning Prices in the new planning price chart presented here. The USDA Planning Prices were generated in response to the emerging biofuels era.
USDA projects that feeder cattle prices will adjust downward over the next 3 or 4 years trying to find the new equilbrium with the emerging biofuels era of increased corn prices. With corn prices projected to average higher in 2008, we could well see some feeder cattle price adjustments for the next 18-24 months.
They project that once that equilbrium is found around 2009 to 2010, beef cow producers will begin to expand the beef cow herd driving prices up for the first few years of the expansion. The expanded production will eventually pull beef prices back down by 2015 or so.
Feeder cattle prices are projected to make the biggest adjustment (compared to feeder calf prices) due to increased corn prices. Limited beef cow numbers, coupled with over capacity in the feedlot sector, is projected to add strength to feeder calf prices. Relatively high calf prices, coupled with lower costs of gain for growing feeders on forages, suggests that the industry will be able to adjust to the projected wide buy/sell margins between weaned calf and feeder cattle prices.
As has been traditionally done with retained ownership of calves, ranchers are projected to continue to subsidize growing feeders with the profits made from producing weaned calves. As done in the past, faulty accounting practices will prevent many beef cow producers from again realizing that they are subsidizing the growing and finishing phases in the emerging biofuel era.
# posted by Dr. Harlan Hughes @ 12:33 PM
Monday, June 25, 2007
Input form For Calculating Cost Of Raised Replacement Heifers


 Double click on a page icon and a larger version of that page will load into your computer. Then, you can printout that page with your browser's print command. To print the next page, click the left arrow on your browser and return to the previous web page. Then repeat this whole process for the next page.
There is an example completed input form, a blank input form for your use, and a detailed table of the heifer grower ration used in my heifer cost example. The example results are presented on the BEEF Magazine web page as my May 2007 Market Advisor.
Fall calf prices peaked In 2005, and the current beef-price cycle is expected to trend lower for a few years as the emerging biofuels era plays out. Thus, measuring and controlling heifer replacement costs over the next 3-4years is critical. Managing home-raised, replacement heifer numbers has much more impact on a rancher's unit cost of producing a hundredweight of calf (UCOP) than ranchers typically believe.
The quickest way to increase UCOP is to hold backadded replacement heifers. Conversely, the quickest way to lower UCOP is to reduce the heifer calves held back as replacements.
Where the cost of raising replacementheifers is concerned, cash accounting will lead most ranchers down a primrosepath. That's because cash accounting underestimates the true economic costs of raising replacement heifers. In fact, I project some ranchers will lose substantial money raising replacement heifers over the next few years and not even be aware of it. Ranchers are currently producing record high-cost replacement heifers destined to produce mid-priced calves for the rest of this decade and into the next- a recipe for financial stress. The cost of replacement heifers should be based on "economic costs"(opportunity costs), not "cash costs."
If you don't hold back replacement heifers, you have the "opportunity" to sell them at weaning. The feed used to raise replacementheifers could be sold, or fed to other animals. If you don't develop your own re-placement heifers, you can run more mature cows.
I have included an example input form used to calculate the cost of rasing replacement heifers. The actual calculations are published as my Market Advisor in the May 2007 BEEF Magazine.
I have included an example input form used to calculate the cost of rasing replacement heifers. The actual calculations are published as my Market Advisor in the May 2007 BEEF Magazine.
You can double click on the input form icons for the example and blank input forms and a larger version will load into your computer. You can use your browser's print command to print out the input forms. After print the first page, click the left arrow on your brower to return to previous web page and double click the next input form. Then, print it with your browser.
Send your completed input form, along with a check for $99, to harlan.hughes@gte.net and I will generate a heifer replacement cost for your herd and email it back to you. This service is available free to paid IRM clients and NCIS Risk Management Workshop Participants.
# posted by Dr. Harlan Hughes @ 11:30 AM
Tuesday, June 12, 2007
US Weekly Ave 550 Lb Steer Calf Prices For 5 Years
The general level of calf prices has really raised since 2002. Prices peaked in 2005 and in 2006. Fall prices went up in 2005 with the expectations that the re-entry into the Japanese market would begin in late 2005 and early 2006. Calf prices during the last part of 2005 were drive by market hype rather than market fundamentals. The Japanese market did open up in mid 2006 but at a snails pace. It still is operating at a snails pace.


Fall 2006 calf prices were driven down by the rapid increase in corn prices.
In spite of the high 2007 corn prices, 2007 calf prices are being driven by $100 slaughter cattle. Current slaughter cattle prices in the $90s is still driving calf prices. $100 cattle prices does a lot to relieve $4.00 corn prices!!
You can load a larger version of this chart into your computer by double clicking on the chart to the left. Then, you can print the larger chart from your computer.
# posted by Dr. Harlan Hughes @ 8:23 PM
Monday, June 11, 2007
Lives Cattle Prices
Here is a chart of 2007 slaughter cattle prices compared to 2006 and the last 5-year average. Double click the graph and a larger verion will load on to your computer. You can then print the larger version if you so desire.
 Double click the graph and a larger verion will load on to your computer. You can then print the larger version if you so desire.
# posted by Dr. Harlan Hughes @ 9:05 AM
Thursday, May 10, 2007
Japanese Beef Exports Grow Ever So Slow

First it was all the speculation of beefexport resumption to Japan and US elections, and then several presidential meetings. Some trade to Japan started, and then itstopped. And then it started again, amounting to a sliver of what used to be a very lucrative market (see chart). Now US beef packers speak enthusiastically of resumed beef exports to S. Korea and some beef is indeed moving to that market, likely a measure of good faith following the conclusion of a last minute FTA agreement.
But if beef exports were part of the FTA negotiations, then what happensif the deal is scuttled by an increasingly resentful US congress. As the Economist magazine recently put it "(the FTA approval) ha seven longer odds. Mr. Bush has little political capital even within his own party. And Congress is controlled by the Democrats, many of whom are deeply opposed to new trade agreements, most of whom want to get tougher on China and few of whom want to give theWhite House a political victory."
Bottom line: US beef will again move to Asian market.But it will likely be a long process, with little to no impact on current markets. But it makes for good conversation and one more bullet point when laying out market drivers.
source: CME Daily Email Newsletter 10 May 2007
Labels: Beef Export Charts May
# posted by Dr. Harlan Hughes @ 2:58 PM
Sunday, March 11, 2007
Make-Up Of Beef Exports

I thought you might be interested in the make-up of U.S. beef exports.
# posted by Dr. Harlan Hughes @ 11:57 AM
Tuesday, February 20, 2007
USDA Slaughter Cattle Planing Prices -- Feb07

Each month USDA prepares a set of Planning Prices for Agriculture. This table presents USDA's Feb Slaghter Cattle Planning Prices. It is interesting to note that these planning prices are several dollars below the current Futures Market Prices for the same time periods. This suggests, at least to me, that USDA is expecting slaughter cattle Futures Prices to weaken some throughout the 2007 year.
Double click the table and a larger version will load into your computer. Use your browser's print command to print the table.
# posted by Dr. Harlan Hughes @ 4:16 PM
Saturday, February 17, 2007
Long-Run 400-500 Lb Calf Prices

+(3).jpg)
+(2).jpg)
I thought I would share a set of long-run steer calf prices that I generated recently. Over the years, I have used this slide to present the beef price cycles that have occurred since the early 1970s. I recommend that you go to the 3rd slide first, the middle slide second, and the top slide last.
The top slide presents an analysis of the "U" or "V" shaped beef price cycle of the last several cattle cycles. the key point here is to recognize that beef price cycle tend to go in either a "U" share curve or a "V" shaped curve. This suggests that the current beef price cycle (2005 through 2015) will also be either "U" or "v" shaped. I am unable to predict which it will be. The key point, however, is that I am predicting a downturn in calf prices for the rest of this decade.
The second slide presents the statistical trend line for these prices. I actually had never calculated this line before. What struck me the most, was how calf prices have generally trended upward with the beef price cycles quite clear above and below the trend line.
I argue that ranchers need to know if current prices are above or below the trend line. When current prices are above the trend line, it signals the good times for beef cow producers and when current prices are below the price line, it signals tough times for beef cow producers.
You can print the two charts by first double clicking on the figure and a larger version will load into your computer. Then, use your browser's print command to print the figure.
# posted by Dr. Harlan Hughes @ 7:18 PM
Friday, February 09, 2007
Map Of Existing & Potential Ethanol Plants

Here is map of existing and proposed ethanol plants in the U.S. Double click the map and a larger version will load into your computer. Use your browser's print command to print this map.
# posted by Dr. Harlan Hughes @ 4:32 PM
Wednesday, January 31, 2007
Net Ranch Income Blank Summary Table For Ranchers to Use
This is a blank Net Ranch Income Table posted here for ranchers to access. Click on the table picture and a larger version will load into your computer. Use your browser printer to print a copy of this blank table.
# posted by Dr. Harlan Hughes @ 9:50 PM
Net Cash Income Blank Table For Rancher Use
This is a blank table for calculating Net Cash Income for ranchers. Click on the table picture and a larger version will load into your computer. You can use your browser's print command to print a copy of this table.
# posted by Dr. Harlan Hughes @ 9:47 PM
Source And Use Of Funds Summary Table (blank form)
This is a blank Source And Use of Funds Table posted here for ranchers to access. Click on the table to load a larger version into your computer and then use your browser's print command to print a copy of this blank table.
# posted by Dr. Harlan Hughes @ 9:44 PM
Manageial Accounting From No 1
.jpg)
This is the first of three Managerial Accounting Froms that I recommend ranchers to use in analyzing their ranch businesses. My March 2007 BEEF Magazine Market Advisor goes into detail about how to use and interpret this form. This article will not be published until March of 2007.
Clicking on the form image will load a larger version into your computer. Use your browser's print command to print this form page. Do the same for the next two posting of pages 2 and pages 3 of this set of Managerial Accounting Forms.
# posted by Dr. Harlan Hughes @ 3:31 PM
Managerial Accounting Form No 2
+(2).jpg)
Here is the Managerial Accounting Form No 2 needed to analysis your ranch buisness. Double click on the form and a larger version will load onto your screen. Then print the impage to get a copy of this form.
# posted by Dr. Harlan Hughes @ 3:28 PM
Managerial Accounting Form No 3
+(3).jpg)
Here is the Managerial Accounting Form needed to calculate Capital Adustments needed to calculate Net Ranch Income.
# posted by Dr. Harlan Hughes @ 3:23 PM
Monday, December 18, 2006
Figure 122: Harlan's Bio Picture

Here is a picture that you can use in your meeting promotion brochure of Harlan Hughes.
# posted by Dr. Harlan Hughes @ 12:05 PM
Sunday, December 17, 2006
Figure 121: Early 2006 Projected Bred Female Prices
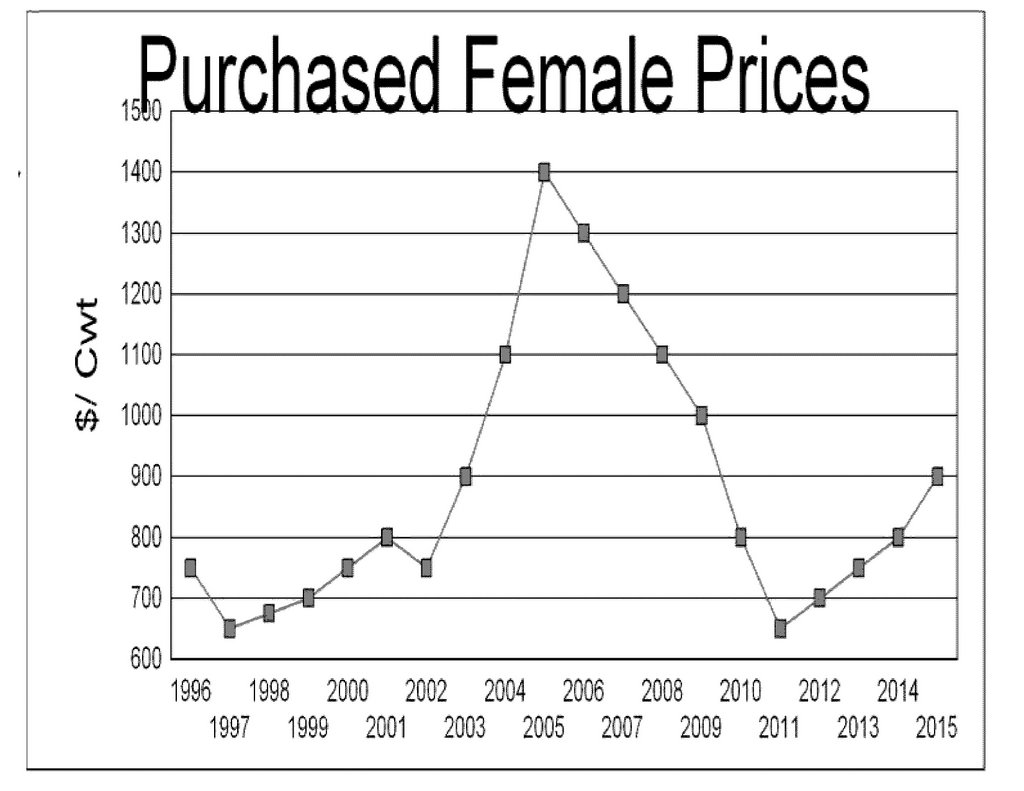
As part of my 2006 drought strategies work, I projected the purchase price of replacement bred females to use in the re-stocking strategies. Remember, these are annual prices. For example, as of Dec 2006 bred replacement heifers are selling in the 1050 to 1200 range but the 2006 annual price is considerably higher.
The key point of this chart is that bred female prices are projected to trend downward the rest of this decade and may even extend a couple of years into the next decade. The one exception might be if a lot of ranchers decide to restock after the 2006 drought all in one year. I doubt that will happen as we will need rain and green grass in all of cow country to trigger a massive re-stocking in one year.
I am often asked about when ranchers should consider buying added heifers. I think it will be towards the end of this decade when weaned heifer calf prices are at the lowest.
# posted by Dr. Harlan Hughes @ 11:37 AM
Friday, December 01, 2006
Figure 120: Market Price Lines For Week 17 Nov 06
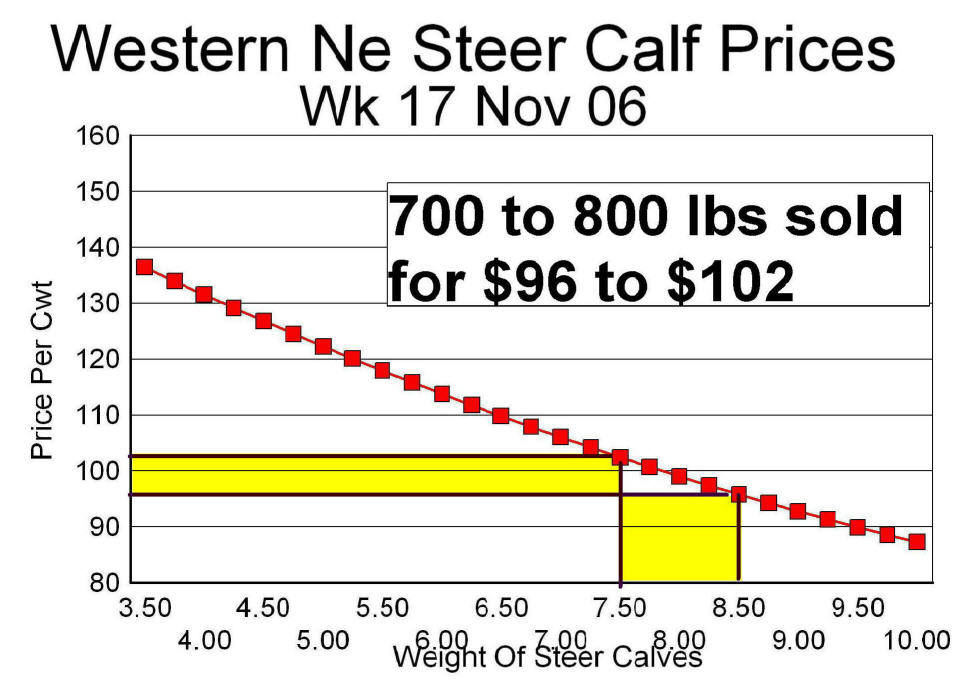
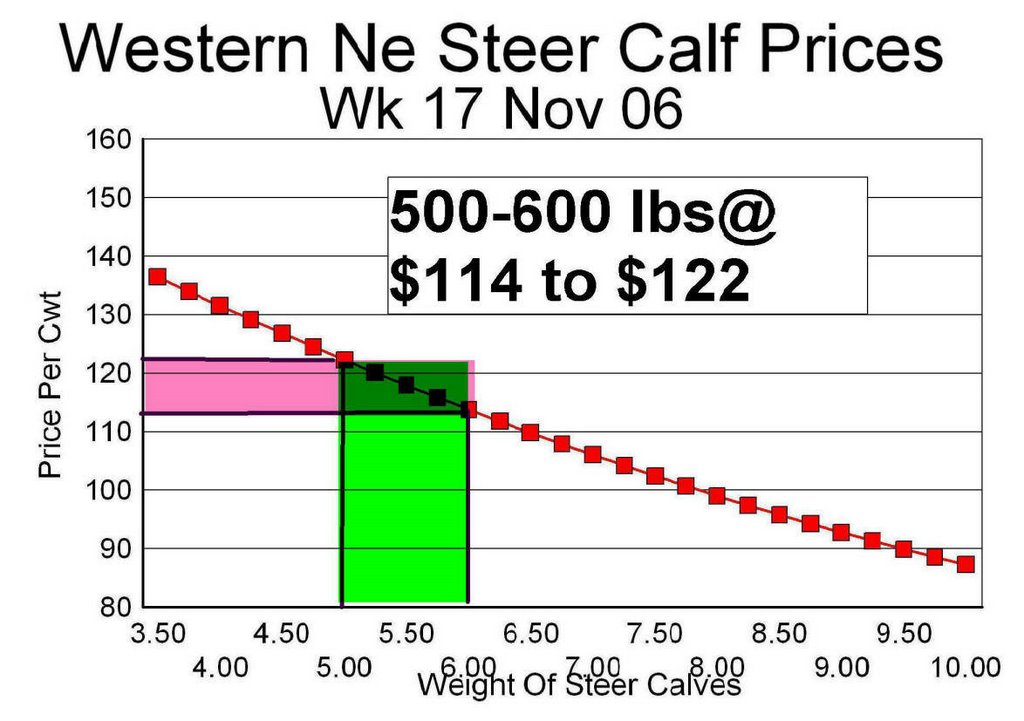
These two market price lines illustrate the Western Nebraska feeder calf and feeder cattle markets the week of 17 Nov 06. It is clear that the increased corn market has impacted feeder cattle prices more than feeder calf prices. I am suggesting that me might see corn prices now in the $3.00 per bushel area compared to the $2.00 or lower era of past few years.
# posted by Dr. Harlan Hughes @ 3:06 PM
Family Living Draw For North Dakota Famers & Ranchers

Farm Business Management Data for North Dakota clearly indicates Family Living Draw is increasing for farmers and ranchers. This chart suggests that Family Living Draw is increasing $1500 per year. This is equal to the typical net cash income generated from 15 beef cows. This, then, suggests that ranchers need to add 15 cows per year just to cover the added family living draw!
# posted by Dr. Harlan Hughes @ 2:55 PM
Sunday, October 22, 2006
Figure 118: Beef Cow Slaughter Up In 2006

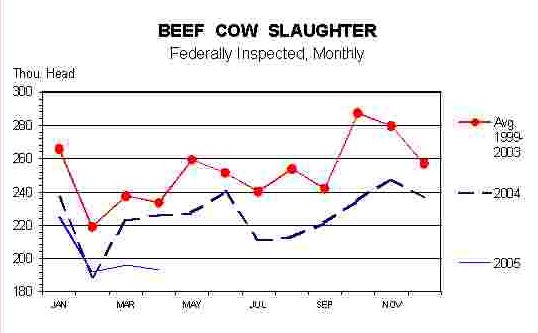
The 2006 drought has resulted in increased beef cow slaughter year to date. It looks like one drought strategy has been to sell cull cows early. If these cows were going to be culled any way, this does not imply that the growth in cattle numbers has stopped. If added cows are slaughtered in 2006, it would suggest that the growth in cattle numbers has slowed or even stopped. It is to early to determine for sure.
Tuesday, September 12, 2006
Figure 117: Creep Feeding Economics Calculator

This Creep Feeding Calculator was developed to get a quick eocnomic analysis of creep feeding 2006 calves during the 2006 drought. This is a typical run to provide some indication of the economics of creep feeding.
Click on the Talbe to enlarge and to print the Table.
Sunday, September 10, 2006
Figure 116: Breakeven Grass Cattle Calculator

This is spreadsheet breakeven calculator for grass cattle. It is designed to tell the user what price he can pay for grass cattle going on grass. You pick the selling price (I use futures) and you pick the desired profit level. The computer calculates the breakeven purchase price that is projected to earn your stated profit level.
Click on the table to enlarge and to print it.
Figure 115: Feeder Calf Price Line For Billings, Mt wk of 8 Sep 06

This Price Line relates Billings, Mt feeder steer prices to steer weights for the week of 8 Sep 2006. The slope of this price line at each weight is the market price slide. The curature of the line tells us that the price slide is not not linear as is often implied at video autions.
Figure 114:Table Of Billings Steer Calf Prices Wk Of 8 Sept 06

This is a user friendly table of Billings market priced for feeder calves. Prices are reported in 25 lb increments so that ranchers can find a price for the weight of their particular calves. Click on the table to receive an enlarged view and to print out the table.
Figure 113: 500 to 600 lb Feeder Prices At Billings Wk of 8 Sep 06
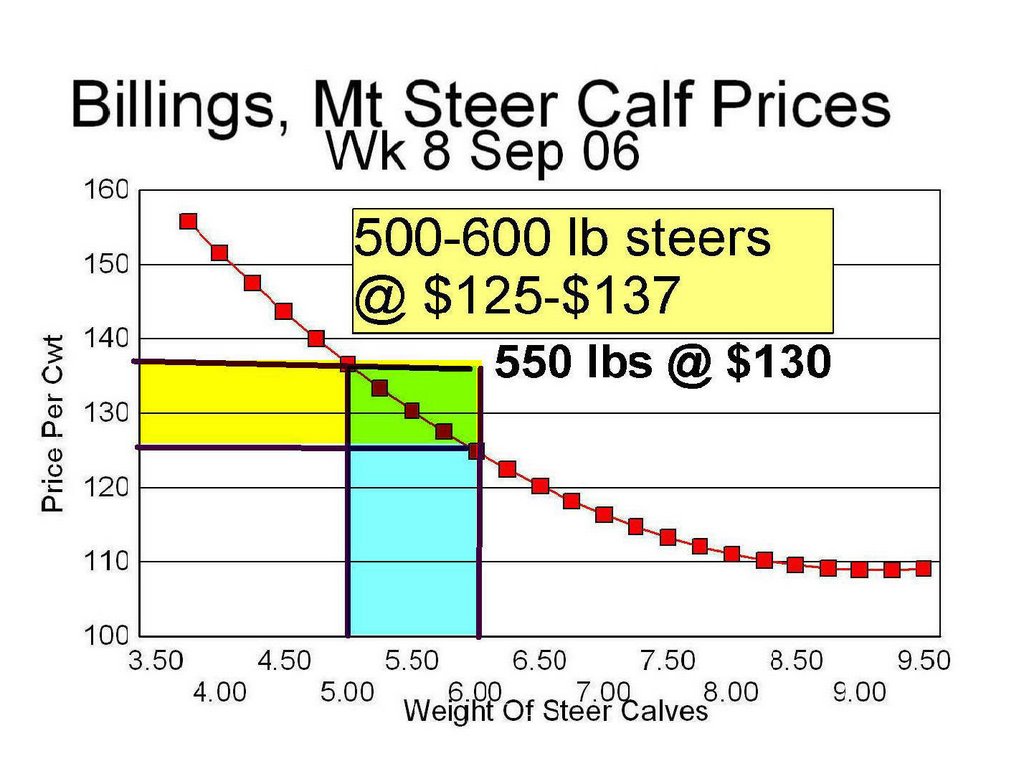
This is a chart of Feeder Calf prices at Billings, Mt for the week of 8 Sep 2006. Click on the chart to get an enlarge picture and to print the chart.
Figure 112: Billings Steer Calf Prices Wk of 8 Sep 06

This is a summary of feeder calf prices in Billings the week of 8 Sep 2006. Click on the picture to enlarge and print the chart.
Wednesday, August 09, 2006
Figure 111: S.D. Pasture Rents For 2005 and 2006
Clearly, pasture rental rates have increased in the last few years with the record calf prices. The source of this data was SDSU Ecoomics Section on the web. 

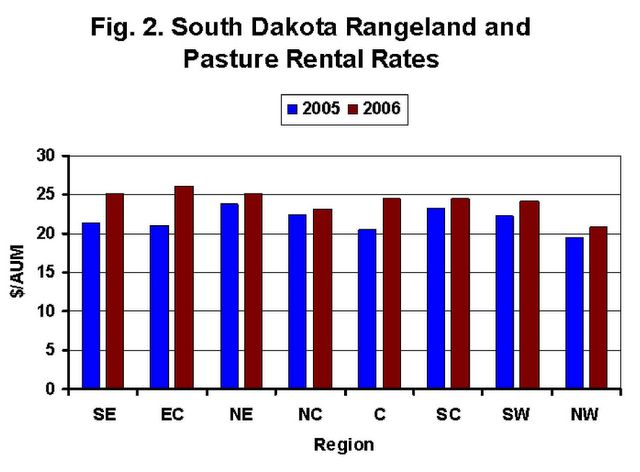
Figure 110: U.S. Choice-Select Spread
The U.S. Choice-Select spread is very wide in 2006. This suggests we are short of choice cattle. I wonder why we can not produce more choice cattle?


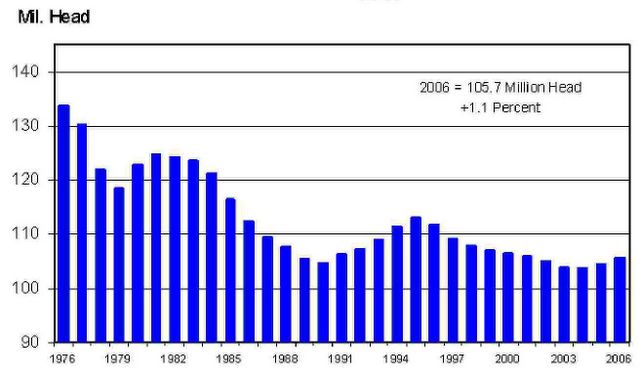
Figure 109: USDA's July All-Cattle Inventory 1976-2006
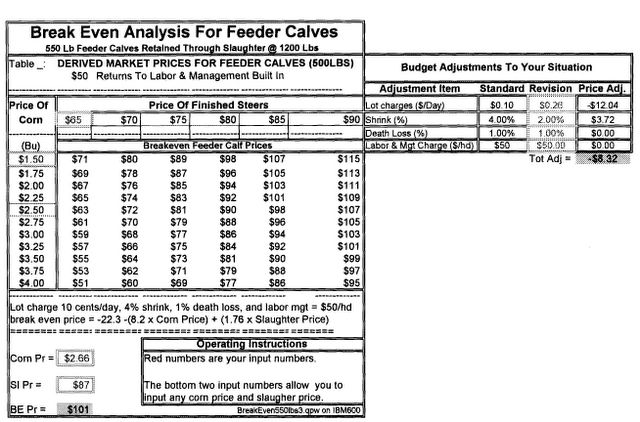
Figur 108: Aug06 Breakeven 550 Lb Feeder Calf To Be Finished
Thursday, July 13, 2006
Chart 107: North Dakota Beef Cow Benchmark Data (2005)
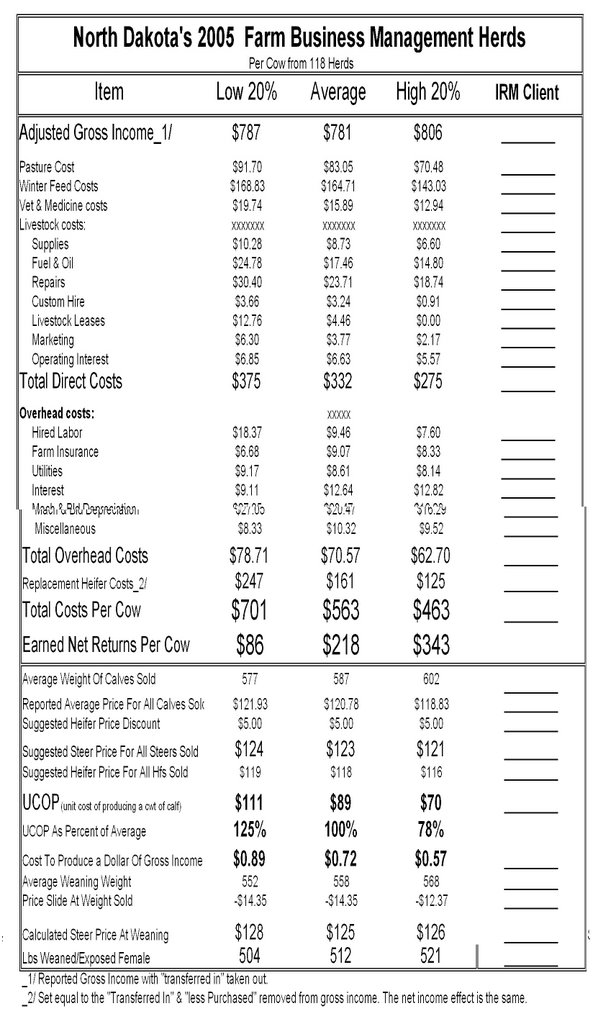
This is the best beef cow benchmark data that I have available. The herds are sorted intot he Low profit 20%, the average of all herds, and the 20% high profit herds.
![]()
